
|
buildfarm_perf_tests package from buildfarm_perf_tests repobuildfarm_perf_tests |
Package Summary
| Tags | No category tags. |
| Version | 0.0.0 |
| License | Apache License 2.0 |
| Build type | AMENT_CMAKE |
| Use | RECOMMENDED |
Repository Summary
| Description | Performance tests which run regularly on the buildfarm |
| Checkout URI | https://github.com/ros2/buildfarm_perf_tests.git |
| VCS Type | git |
| VCS Version | master |
| Last Updated | 2024-02-16 |
| Dev Status | UNMAINTAINED |
| CI status | No Continuous Integration |
| Released | UNRELEASED |
| Tags | No category tags. |
| Contributing |
Help Wanted (0)
Good First Issues (0) Pull Requests to Review (0) |
Package Description
Additional Links
Maintainers
- Scott K Logan
Authors
buildfarm perf tests
![]()
Purpose
This package defines some tests.
On one hand it invokes perf_test from Apex.AI’s performance_test package.
This allows you to test performance and latency of several ROS 2 RMW implementations.
On the other hand we are evaluating the additional overhead caused by a single pub/sub topic or one process spinning and detect potential leaks related to theses activities.
-
There is a test for each RMW:
- CycloneDDS (standalone test)
- FastRTPS (standalone test)
- rmw_connext_cpp
- rmw_cyclonedds_cpp
- rmw_fastrtps_cpp
- rmw_fastrtps_dynamic_cpp
- rmw_opensplice_cpp
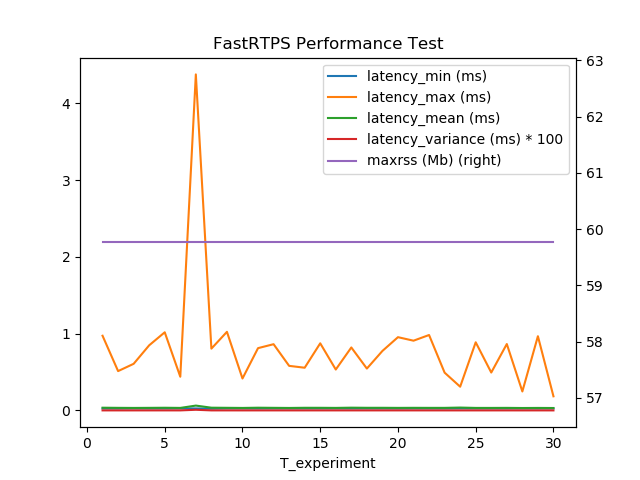
Test 1 - Performance Test (Apex.AI)
In this test we are running the Performance Test provided by Apex.AI. Right now we have our own fork because there are some pending pull requests in the official gitlab repository.
In this test we are measurement:
- Average latency
- CPU usage (provided by Apex.AI tool)
- Sent/Received messages per second
- Total lost messages
- Max resident set size
We are generating two plots per measurement
The test only measures the latency between the same RMW implementation
| Publisher/Subscriber | rmw_fastrtps_cpp | rmw_opensplice_cpp | rmw_cyclonedds_cpp | rmw_fastrtps_dynamic_cpp | rmw_connext_cpp |
|---|---|---|---|---|---|
| rmw_fastrtps_cpp | :heavy_check_mark: | :heavy_multiplication_x: | :heavy_multiplication_x: | :heavy_multiplication_x: | :heavy_multiplication_x: |
| rmw_opensplice_cpp | :heavy_multiplication_x: | :heavy_check_mark: | :heavy_multiplication_x: | :heavy_multiplication_x: | :heavy_multiplication_x: |
| rmw_cyclonedds_cpp | :heavy_multiplication_x: | :heavy_multiplication_x: | :heavy_check_mark: | :heavy_multiplication_x: | :heavy_multiplication_x: |
| rmw_fastrtps_dynamic_cpp | :heavy_multiplication_x: | :heavy_multiplication_x: | :heavy_multiplication_x: | :heavy_check_mark: | :heavy_multiplication_x: |
| rmw_connext_cpp | :heavy_multiplication_x: | :heavy_multiplication_x: | :heavy_multiplication_x: | :heavy_multiplication_x: | :heavy_check_mark: |
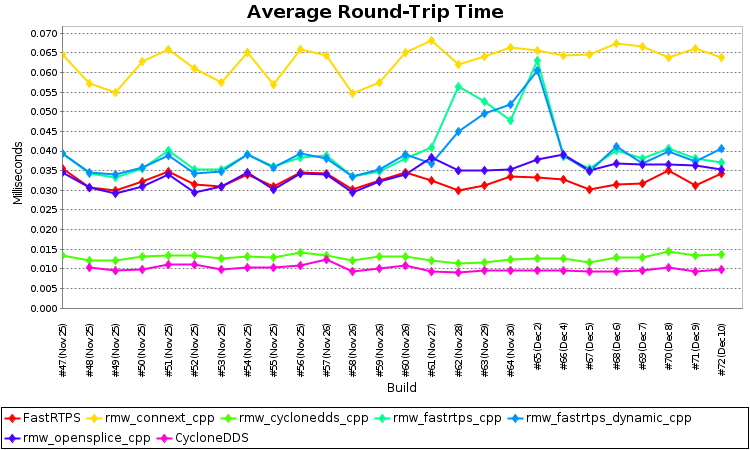
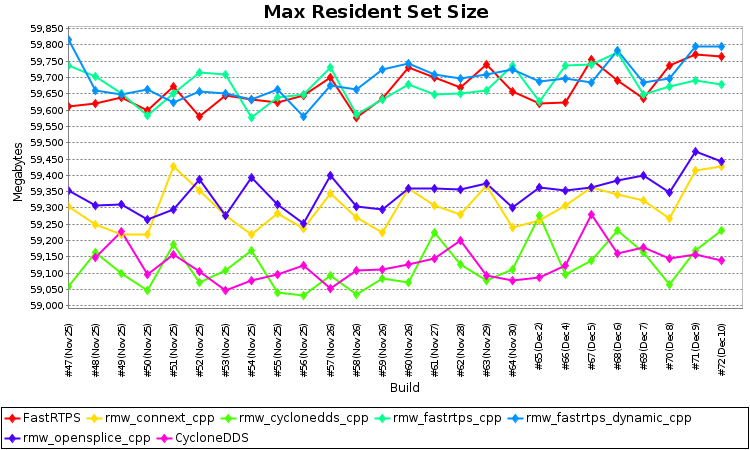
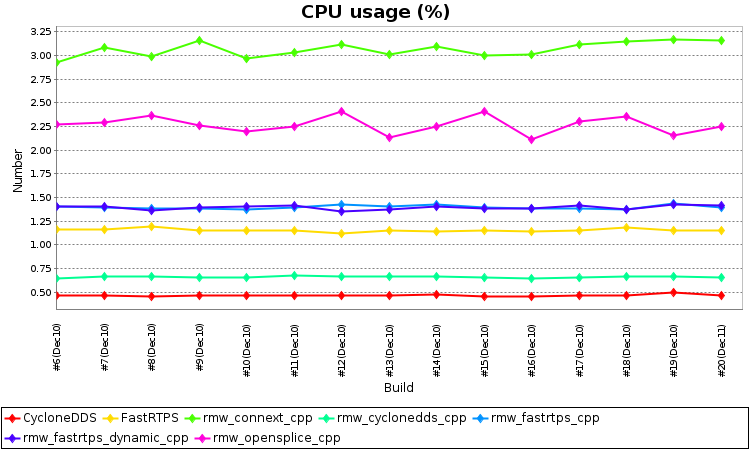
Test 2 - Simple pub/sub
In this case we are testing one publisher and one subscriber in different processes sending a 1kArray at 5Hz. This will allow us to evaluate additional overhead caused by a single pub/sub topic and detect leaks related to this activity.
We measure for both publisher and subscriber:
- Average round trip
- CPU usage ( readed from the filesystem )
- Total lost messages
- Received/Sent messages per second
- Physical memory
- Resident anonymous memory
- Virtual memory
Again we plot measurement:
| Publisher/Subscriber | rmw_fastrtps_cpp | rmw_opensplice_cpp | rmw_cyclonedds_cpp | rmw_fastrtps_dynamic_cpp | rmw_connext_cpp |
|---|---|---|---|---|---|
| rmw_fastrtps_cpp | :heavy_check_mark: | :heavy_check_mark: | :heavy_check_mark: | :heavy_check_mark: | :heavy_check_mark: |
| rmw_opensplice_cpp | :heavy_check_mark: | :heavy_check_mark: | :heavy_check_mark: | :heavy_check_mark: | :heavy_check_mark: |
| rmw_cyclonedds_cpp | :heavy_check_mark: | :heavy_check_mark: | :heavy_check_mark: | :heavy_check_mark: | :heavy_check_mark: |
| rmw_fastrtps_dynamic_cpp | :heavy_check_mark: | :heavy_check_mark: | :heavy_check_mark: | :heavy_check_mark: | :heavy_check_mark: |
| rmw_connext_cpp | :heavy_check_mark: | :heavy_check_mark: | :heavy_check_mark: | :heavy_check_mark: | :heavy_check_mark: |
Test 3 - Node spinning
This test creates one process and spins for 1 minute to evaluate ROS 2 overhead and detect obvious leaks.
We measure:
- CPU usage ( readed from file system )
- Physical memory
- Resident anonymous memory
- Virtual memory
Again we plot measurement:
| DDS | Process 1 |
|---|---|
| rmw_fastrtps_cpp | :heavy_check_mark: |
| rmw_opensplice_cpp | :heavy_check_mark: |
| rmw_cyclonedds_cpp | :heavy_check_mark: |
| rmw_fastrtps_dynamic_cpp | :heavy_check_mark: |
| rmw_connext_cpp | :heavy_check_mark: |
Build
- Install ROS 2 (https://index.ros.org/doc/ros2/Installation/).
- Source the ROS 2 installation (either
/opt/ros/<rosdistro>/setup.bashif installing from binaries, or~/ros2_ws/install/setup.bashif building from source):-
source /opt/ros/<rosdistro>/setup.bashorsource ~/ros2_ws/install/setup.bash
-
- Make a new workspace and clone this repository into it:
mkdir -p ~/performance_ws/srccd ~/performance_wswget https://github.com/ros2/buildfarm_perf_tests/raw/master/tools/ros2_dependencies.reposvcs import src < ros2_dependencies.reposrosdep install --from-path src --ignore-src
- Build the local workspace:
colcon build
- Source the local workspace:
source install/local_setup.bash
Run
colcon test --packages-select buildfarm_perf_tests --event-handlers console_direct+
Details
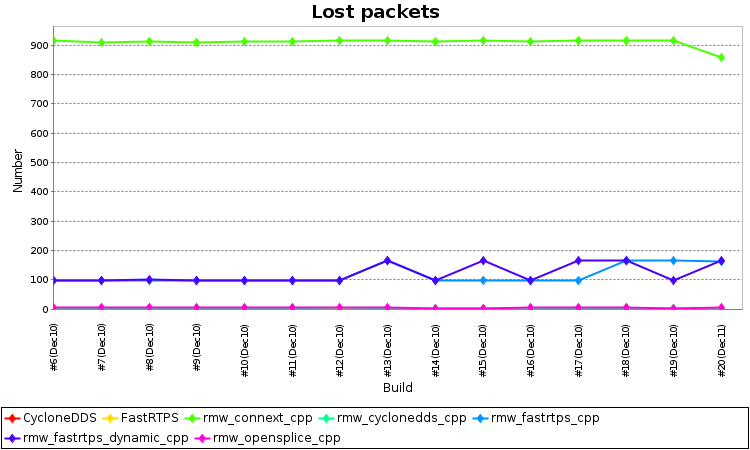
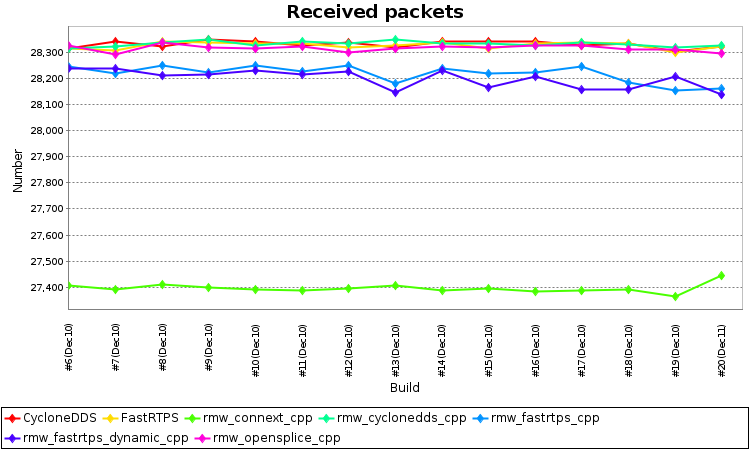
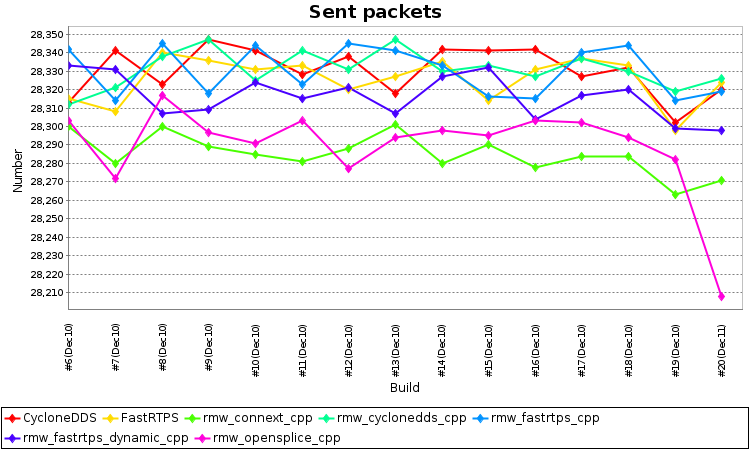
Note: the graphs presented here are for demonstration purposes only. The data in the graphs are not meant to be accurate or current.
- Each test runs for 30 seconds with a 1k payload, but this can be changed using CMake variables.
-
PERF_TEST_RUNTIME: Maximum number of seconds to run before exiting. Zero runs forever. -
PERF_TEST_TOPICS: Topics to use. These are all available topics:Array1k,Array4k,Array16k,Array32k,Array60k,Array1m,Array2m,Struct16,Struct256,Struct4k,Struct32k,PointCloud512k,PointCloud1m,PointCloud2m,PointCloud4m,Range,NavSatFix,RadarDetectionandRadarTrack.
For example, If we want to run the test during 30 seconds using the topic Array1k:
colcon build --packages-select buildfarm_perf_tests --cmake-args -DPERF_TEST_RUNTIME="30" -DPERF_TEST_TOPICS="Array1k;Array4k" --no-warn-unused-cli
- Each test produces a PNG plot of various measures across time, displayed in Jenkins using the image gallery plugin.
- These plots are displayed on the build’s summary page, and are part of the output artifacts for the build.
- These plots are displayed on the build’s summary page, and are part of the output artifacts for the build.
-
Each test also produces a couple of aggregated measures in a small csv file, used to plot build-over-build using the Jenkins plot plugin.
- To see these plots, click the “Plots” link on the left side of the JOB summary (not a build summary)
- You should be able to click one of those points to jump to the aforementioned PNG plot that produced that aggregated point.
System metrics collector tool
This tool allows to create statistics based on the name of the process and arguments. This tool allows to collect the following statistics:
- CPU usage (%): This information is fetched from
/proc/stat. - CPU memory virtual, ResidentAnonymousMemory and physical: This information is fetched from
/proc/meminfo. - Process usage (%): This information is fetched from
/proc/<pid/>stat. - Process memory: a) virtual, b) resident anonymous memory and c) physical: This information is fetched from
/proc/<pid/statmand/proc/<pid/status.
These are the argument to launch the tool:
ros2 run buildfarm_perf_tests system_metric_collector -h
Options:
  -h [ --help ]           Help screen
  --timeout arg (=60)     Test duration
  --log arg (=out.csv)    Log filename
  --process_pid arg      process pid
A general overview of what a typical run might do, for example:
- Start process under test. For example
perf_test - Launch
system_metrics_collectorusing the argument--process_pidwith the pid of the process (in this caseperf_test). - Finally
system_metrics_collectorwill fetch the data from the files describe above. If you have include the option--logthen the data it’s recorded in the file otherwise the standard output will show the reading.
Examples
ros2 run performance_test perf_test -c ROS2 -t Array1k &
ps -e | grep perf_test
  8621 pts/5    00:00:01 perf_test
ros2 run buildfarm_perf_tests system_metric_collector -process_pid 8621
Wiki Tutorials
Package Dependencies
| Deps | Name |
|---|---|
| ament_cmake | |
| ament_cmake_python | |
| ament_index_python | |
| launch | |
| launch_ros | |
| ament_lint_auto | |
| ament_lint_common | |
| launch_testing_ament_cmake | |
| performance_test | |
| rmw_implementation_cmake | |
| rclcpp |