
Package Summary
| Tags | No category tags. |
| Version | 0.2.0 |
| License | Apache License 2.0 |
| Build type | AMENT_PYTHON |
| Use | RECOMMENDED |
Repository Summary
| Description | |
| Checkout URI | https://github.com/autowarefoundation/autoware_tools.git |
| VCS Type | git |
| VCS Version | main |
| Last Updated | 2025-05-23 |
| Dev Status | UNMAINTAINED |
| CI status | No Continuous Integration |
| Released | UNRELEASED |
| Tags | No category tags. |
| Contributing |
Help Wanted (0)
Good First Issues (0) Pull Requests to Review (0) |
Package Description
Additional Links
Maintainers
- Yukinari Hisaki
- Satoshi Ota
- Kosuke Takeuchi
- Shintaro Sakoda
- Fumiya Watanabe
Authors
Autoware Debug Tools
This package provides tools for debugging Autoware.
Processing Time Visualizer
This tool visualizes tier4_debug_msgs/msg/ProcessingTimeTree messages.
Usage
- Run the following command to start the visualizer.
ros2 run autoware_debug_tools processing_time_visualizer
-
Select a topic to visualize.
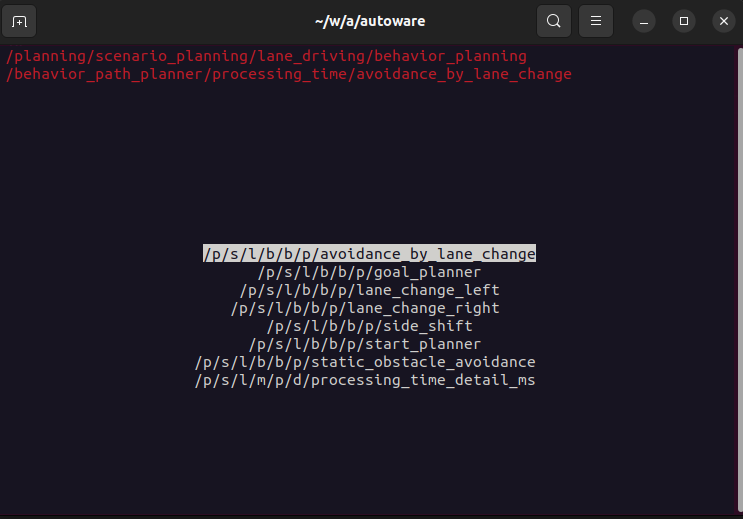
-
Then, the visualizer will show the processing time tree.
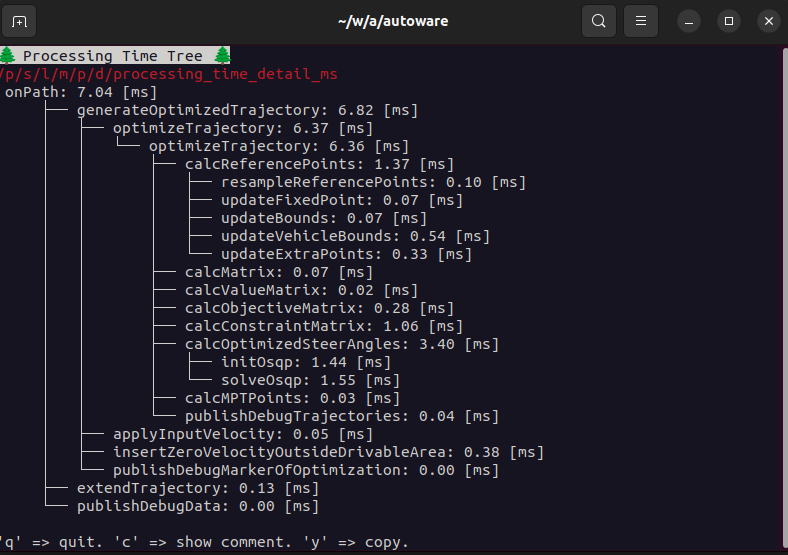
summarized output
Running with --summarize, it will output the summarized information.
> ros2 run autoware_debug_tools processing_time_visualizer --summarize

objectsCallback: 17.99 [ms], run count: 1
    ├── removeStaleTrafficLightInfo: 0.00 [ms], run count: 1
    ├── updateObjectData: 0.03 [ms], run count: 13
    ├── getCurrentLanelets: 4.81 [ms], run count: 13
    │   ├── checkCloseLaneletCondition: 2.43 [ms], run count: 130
    │   ├── isDuplicated: 0.02 [ms], run count: 17
    │   └── calculateLocalLikelihood: 0.66 [ms], run count: 12
    ├── updateRoadUsersHistory: 0.30 [ms], run count: 13
    └── getPredictedReferencePath: 5.47 [ms], run count: 5
        ├── predictObjectManeuver: 0.40 [ms], run count: 5
        │   └── predictObjectManeuverByLatDiffDistance: 0.34 [ms], run count: 5
        │       └── calcRightLateralOffset: 0.03 [ms], run count: 12
        ├── calculateManeuverProbability: 0.01 [ms], run count: 5
        └── addReferencePaths: 4.66 [ms], run count: 15
            ├── updateFuturePossibleLanelets: 0.08 [ms], run count: 8
            └── convertPathType: 4.29 [ms], run count: 8
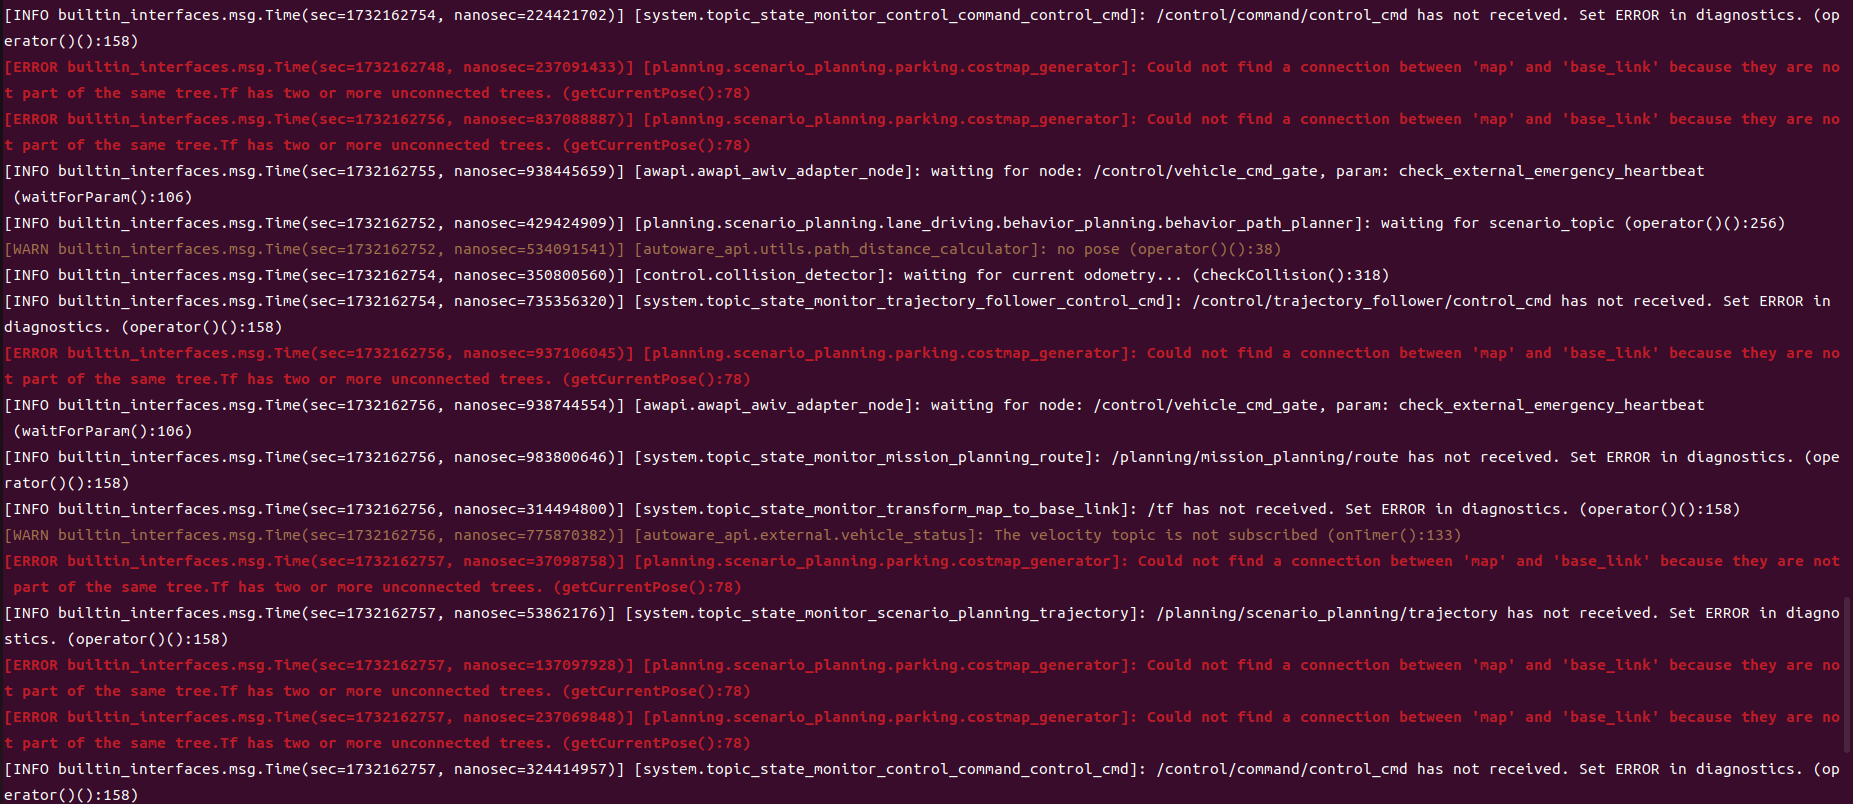
System Usage Monitor
The purpose of the System Usage Monitor is to monitor, visualize and publish the CPU usage and memory usage of the ROS processes. By providing a real-time terminal-based visualization, users can easily confirm the cpu and memory usage as in the picture below.
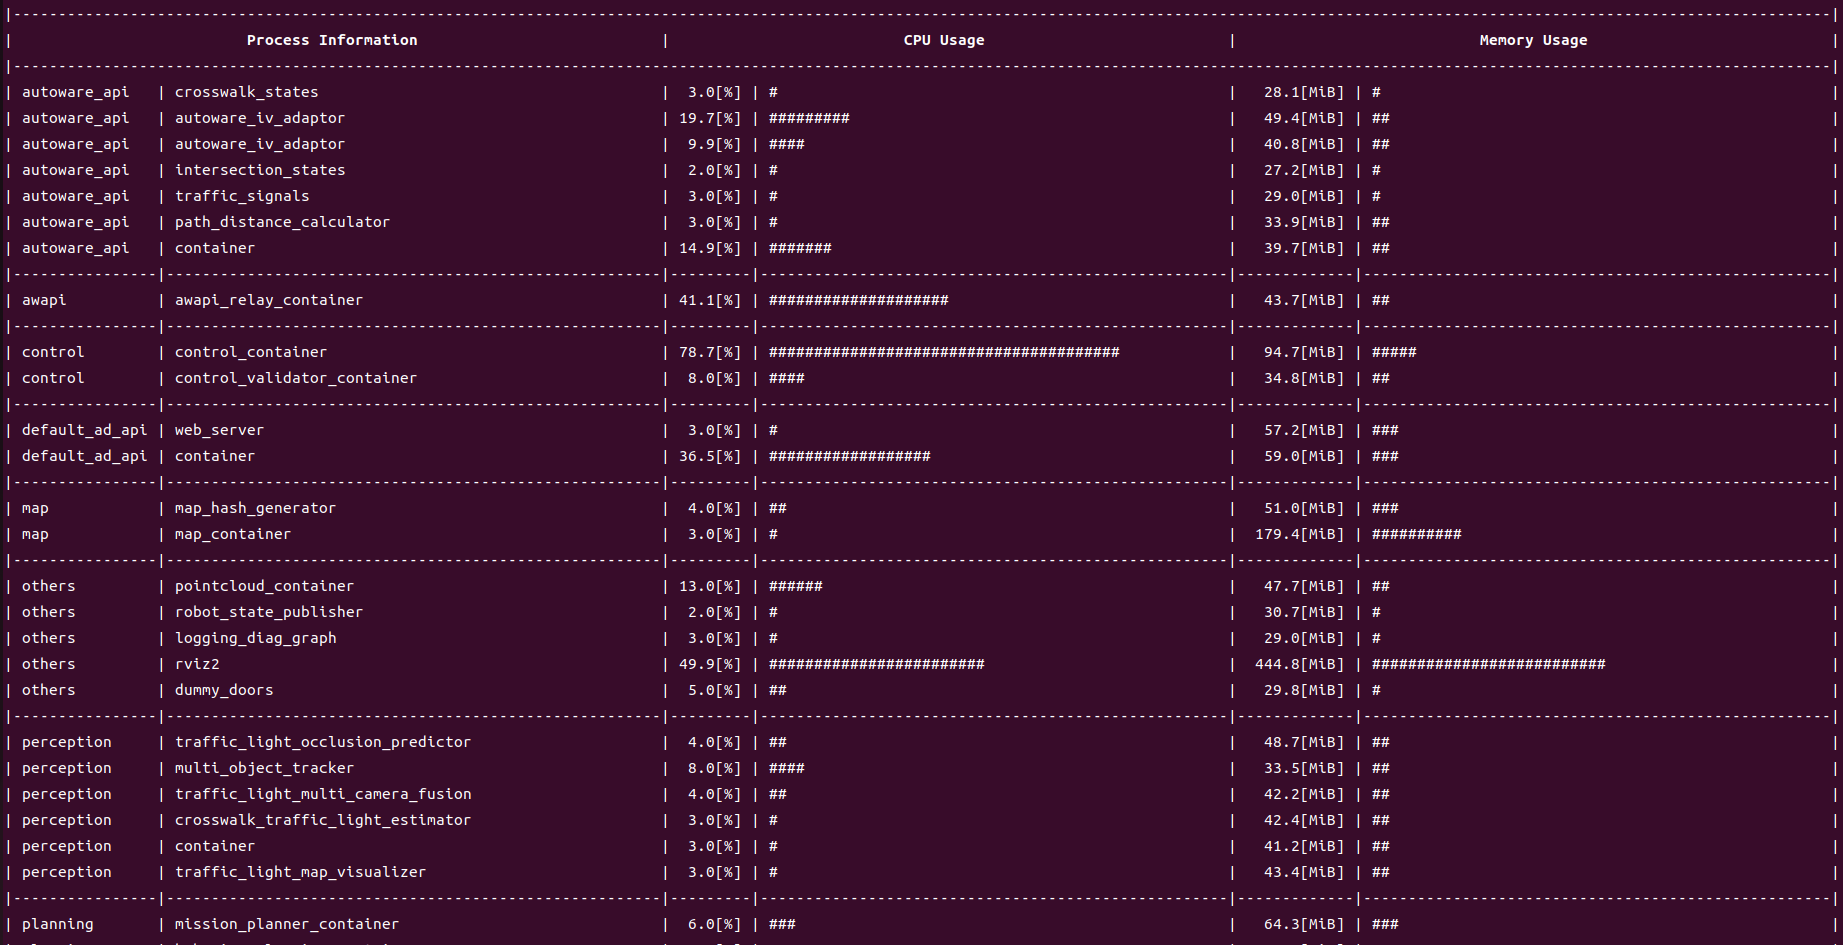
You can run the program by the following command.
ros2 run autoware_debug_tools system_usage_monitor
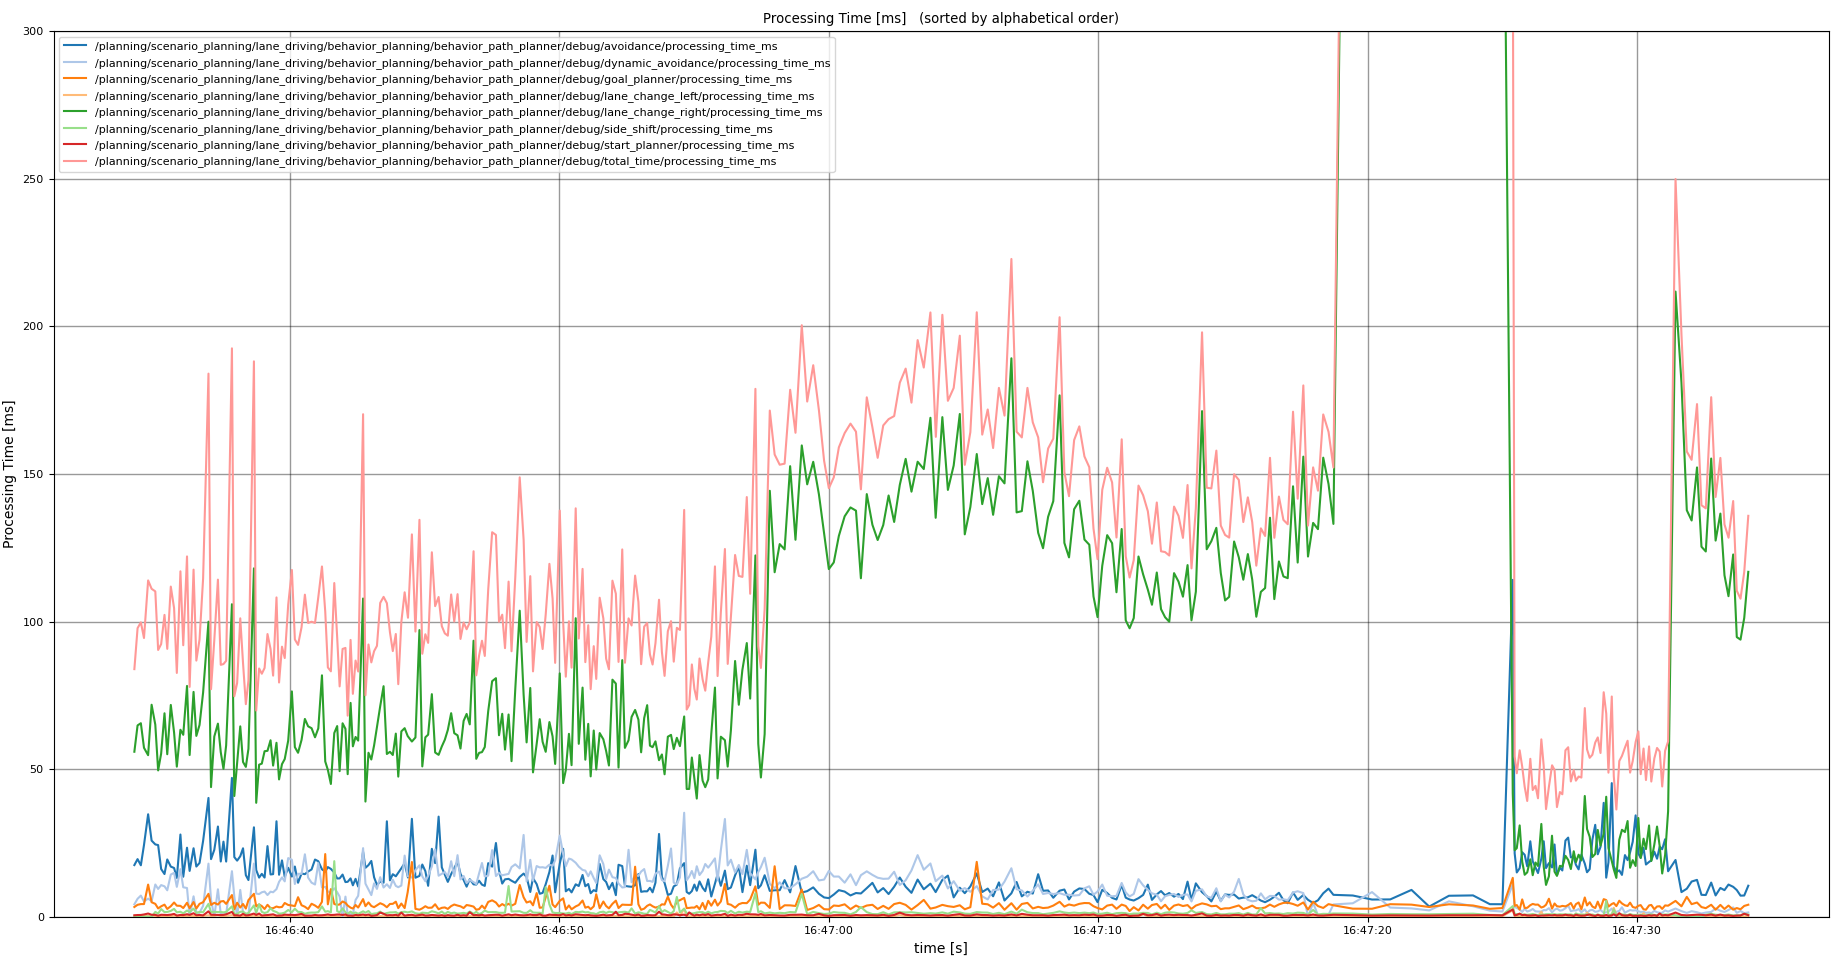
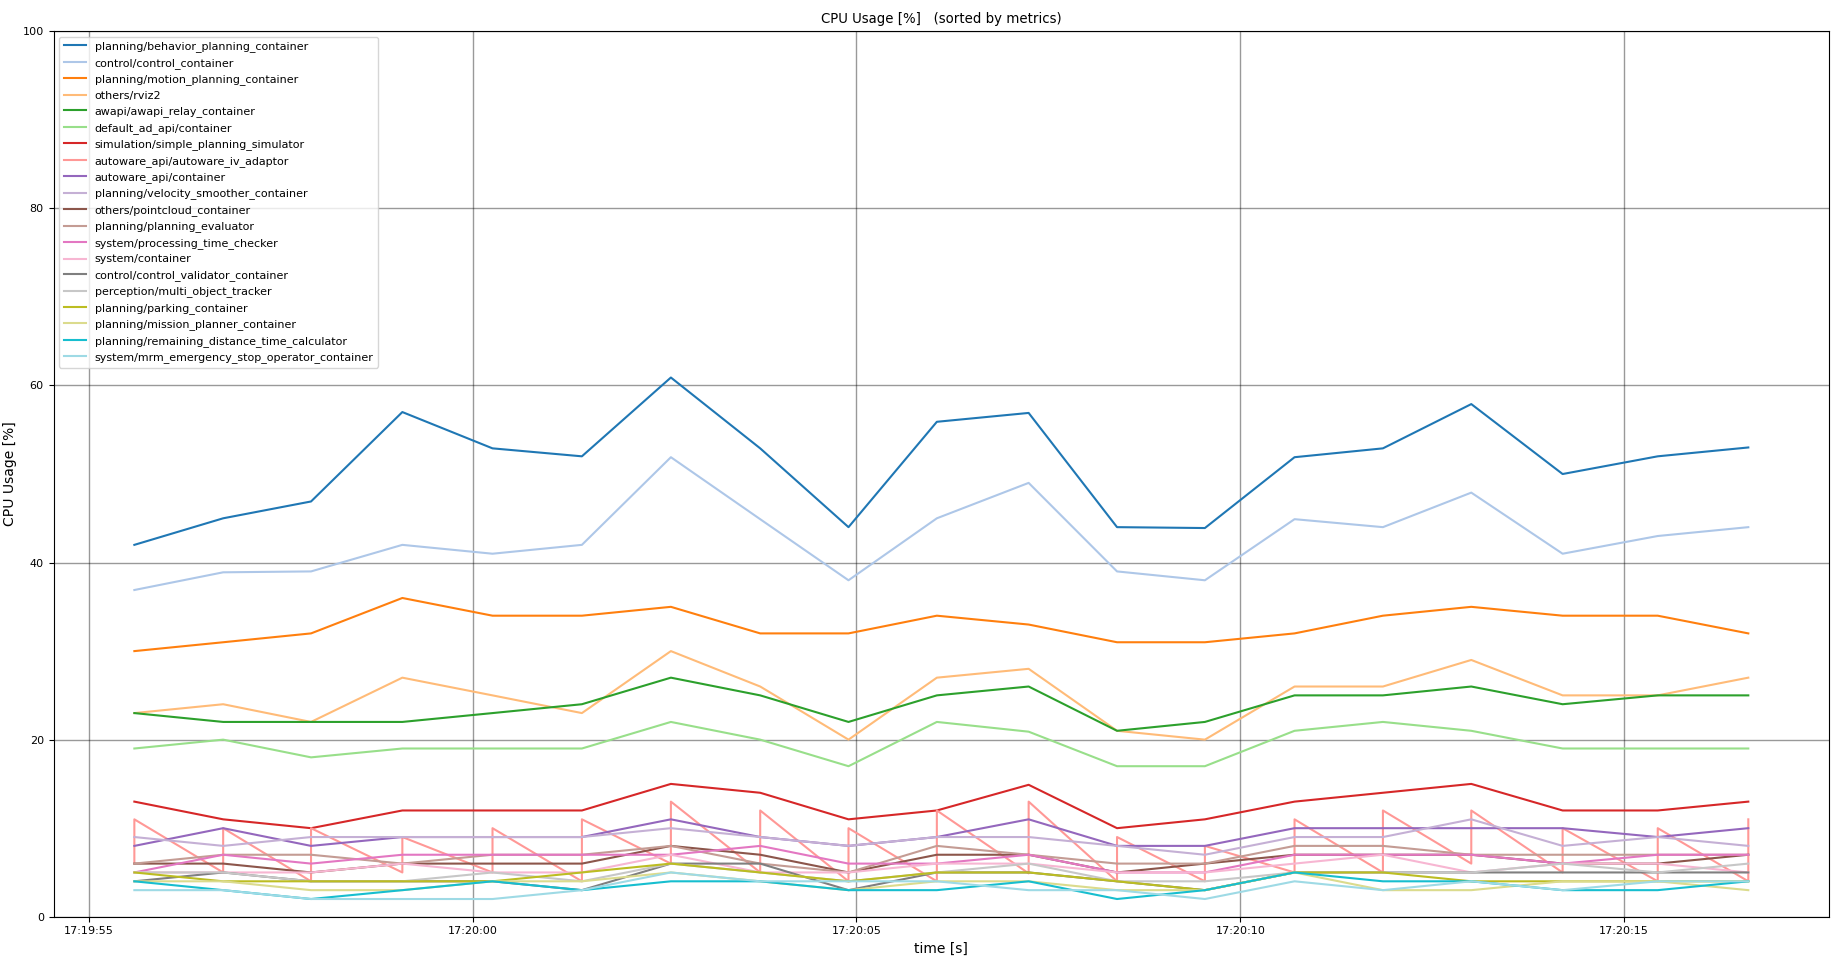
System Performance Plotter
This script plots the following metrics by each Autoware’s module.
- processing time
- CPU usage
- memory usage
Usage
Run the following commands according to your purpose.
# plot processing time
ros2 run autoware_debug_tools processing_time_plotter <bag-path>

# plot CPU usage
ros2 run autoware_debug_tools cpu_usage_plotter <bag-path>

# plot memory usage
ros2 run autoware_debug_tools memory_usage_plotter <bag-path>
There are several options.
-
-c:- can filter modules in the specific component (e.g.
all,planning,system, etc).
- can filter modules in the specific component (e.g.
-
-n <number>:- can pick up top
<number>critical modules.
- can pick up top
-
-g <text>- can filter the modules which include
<text>.
- can filter the modules which include
-
-y <val>- can set the height of the plot to
<val>.
- can set the height of the plot to
Examples
ros2 run autoware_debug_tools processing_time_plotter <bag-path> -c planning -g behavior_path -y 300
ros2 run autoware_debug_tools cpu_usage_plotter <bag-path> -n 20
Rosout Log Reconstructor
This script shows the log from the /rosout topic on the terminal.
Usage
ros2 run autoware_debug_tools rosout_log_reconstructor
Frequent Log Checker
This script shows the frequent log from the launch.log.
In detail, the log which appears more than the threshold times during the duration will be list down.
Usage
ros2 run autoware_debug_tools frequent_log_checker <launch-log-path>
The command has following options.
-
-d: duration to count the number of log -
-c: threshold of the log count during the duration -
-f: log format. Several log formats are pre-defined in the script.
Changelog for package autoware_debug_tools
0.2.0 (2025-03-24)
- fix(autoware_debug_tools): time keeper does not work with the old
message type
(#224)
- fix(autoware_debug_tools): TimeKeeper does not work with the old message type
* fix typo ---------
- feat(autoware_debug_tools): add frequent_log_checker.py
(#172)
- feat(autoware_debug_tools): add frequent_log_checker.py
- minor change
* minor fix ---------Co-authored-by: SakodaShintaro <<rgbygscrsedppbwg@gmail.com>>
- Contributors: Takayuki Murooka
0.1.0 (2025-01-28)
- feat: use autoware_internal_debug_msgs in
processing_time_plotter.py
(#184)
- feat: use autoware_internal_debug_msgs in processing_time_plotter.py
- fix typo: argment -> argument
* fix typo: LINESTYLES -> LINE_STYLES ---------
- chore: sync files (#11) Co-authored-by: github-actions <<github-actions@github.com>> Co-authored-by: pre-commit-ci[bot] <66853113+pre-commit-ci[bot]\@users.noreply.github.com>
- feat(autoware_debug_tools): add rosout_log_reconstructor.py
(#160)
- feat(autoware_debug_tools): add rosout_log_reconstructor.py
* update README.md ---------
- fix: to plot "exe_time_ms" of ndt_scan_matcher
(#161)
- Fixed to plot "exe_time_ms" of ndt_scan_matcher
* style(pre-commit): autofix ---------Co-authored-by: pre-commit-ci[bot] <66853113+pre-commit-ci[bot]\@users.noreply.github.com>
- Added maintainers (#162)
- feat(autoware_debug_tools): add topic connection checker
(#132)
- feat: add topic connection checker, first commit as a proposal
- style(pre-commit): autofix
- implement diagnostic based topic settings; implement the topic localization
- temp
- refactor the codes
- add readme for topic connection checker
- test with debug
- style(pre-commit): autofix
- fix flake8
- ignore rviz2 node, ignore hyper-linked files
* style(pre-commit): autofix ---------Co-authored-by: pre-commit-ci[bot] <66853113+pre-commit-ci[bot]\@users.noreply.github.com>
- fix(system_usage_monitor): change the node search method
(#137)
- Fixed the node search method
* Added a comment ---------
- feat: add "skip_plt_show" arg to plotter
(#136)
- Added "skip_plt_show" arg to plotter
* style(pre-commit): autofix ---------Co-authored-by: pre-commit-ci[bot] <66853113+pre-commit-ci[bot]\@users.noreply.github.com>
- feat: enable to choose topic with argument (#95)
- feat(autoware_debug_tools): processing time total processing tree
(#92)
- feat: add total processing time tree to processing time visualizer
- feat: add percentage of processing time
- feat: add rest of the measured timekeepers
- style(pre-commit): autofix
- feat: print average first and the worst case next
- style(pre-commit): autofix
* feat: refactor processing time tree sum method to summarize_tree ---------Co-authored-by: pre-commit-ci[bot] <66853113+pre-commit-ci[bot]\@users.noreply.github.com>
- feat(autoware_debug_tools): add system performance plotter
(#91)
- feat(autoware_debug_tools): add system performance plotter
- update README
* fix README.md ---------
- feat(processing_time_visualizer): add summarize option
(#90)
- add summarize feature
- add summarize
- style(pre-commit): autofix
- fix typo
- make summarize option dynamic
- apply suggestion
* style(pre-commit): autofix ---------Co-authored-by: pre-commit-ci[bot] <66853113+pre-commit-ci[bot]\@users.noreply.github.com> Co-authored-by: Y.Hisaki <<yhisaki31@gmail.com>>
- fix(autoware_debug_tools): the image of system_usage_monitor was wrong (#87)
- feat(autoware_dubug_tools): add function to report worst time when r is pressed at the end (#86)
- feat(autoware_debug_tools): add system_usage_monitor.py
(#85)
- feat(autoware_debug_tools): add system_usage_monitor.py
* publish system usage ---------
- feat(autoware_debug_tools): add processing time visualizer
(#75)
- feat(autoware_debug_tools): add processing time visualizer
- ignore spell check
* update everythings ---------
- Contributors: Masaki Baba, SakodaShintaro, Taekjin LEE, Takayuki Murooka, Yoshi Ri, Yukinari Hisaki, Yuxuan Liu, awf-autoware-bot[bot]